

Published by GISimple, GEOVisual is an iOS app that enables you to generate unique map-overlay visualisations that give you insight and new perspective on data.
There’s been a lot of hype and hyperbole surrounding the possibilities of Big Data, but for many small-to-medium enterprises, ‘Big Data’ has remained a buzzword without many direct applications. Apps like GEOVisual go some way to closing that gap and providing individuals and companies with useful insights drawn from a data set.
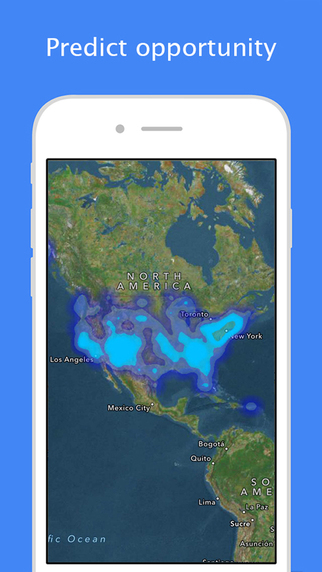

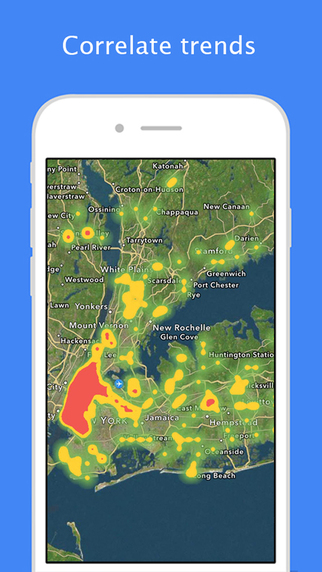
Many people operating either as a sole-trader or within a business have an inherent interest in sales & marketing. What if you could see a map of where your sales or customers are clustered? That kind of visualisation can assist in business decision making as well as helping you discover trends that you may not have noticed.
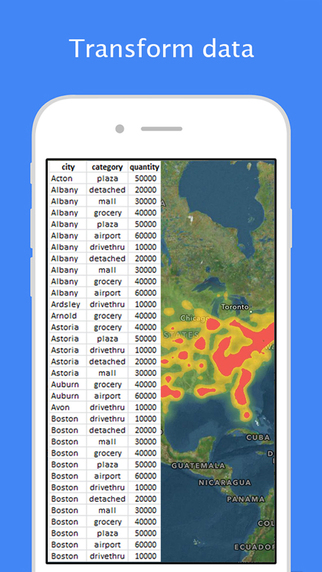
GEOVisual is an iOS app that creates heat-maps on a geographic map from data uploaded via spreadsheet. The data may relate to sales, customer or supplier location and more. You can create intensity, gap and opportunity maps using GEOVisual simply by uploading the relevant data. The app is free to download and use for spreadsheets with up to 50 addresses.
Different pricing plans are available for the premium version of GEOVisual, starting at $4.99 for up to 500 addresses, and $29.99 for up to 3000 addresses.
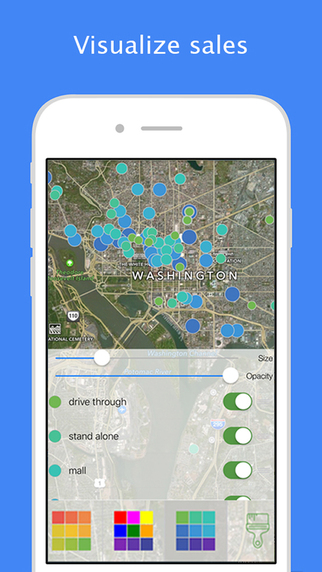
The maps themselves are overlaid on Apple Maps, with a style (including color palette and opacity)
Once a map has been created, you can save the image and/or share it via social networks like Facebook and Twitter.
In summary, GEOVisual provides a great heat-mapping tool for drawing visual insights into your data and as a free download comes highly recommended.
GEOVisual requires iOS 8.0 or later. Compatible with iPhone, iPad, and iPod touch.