


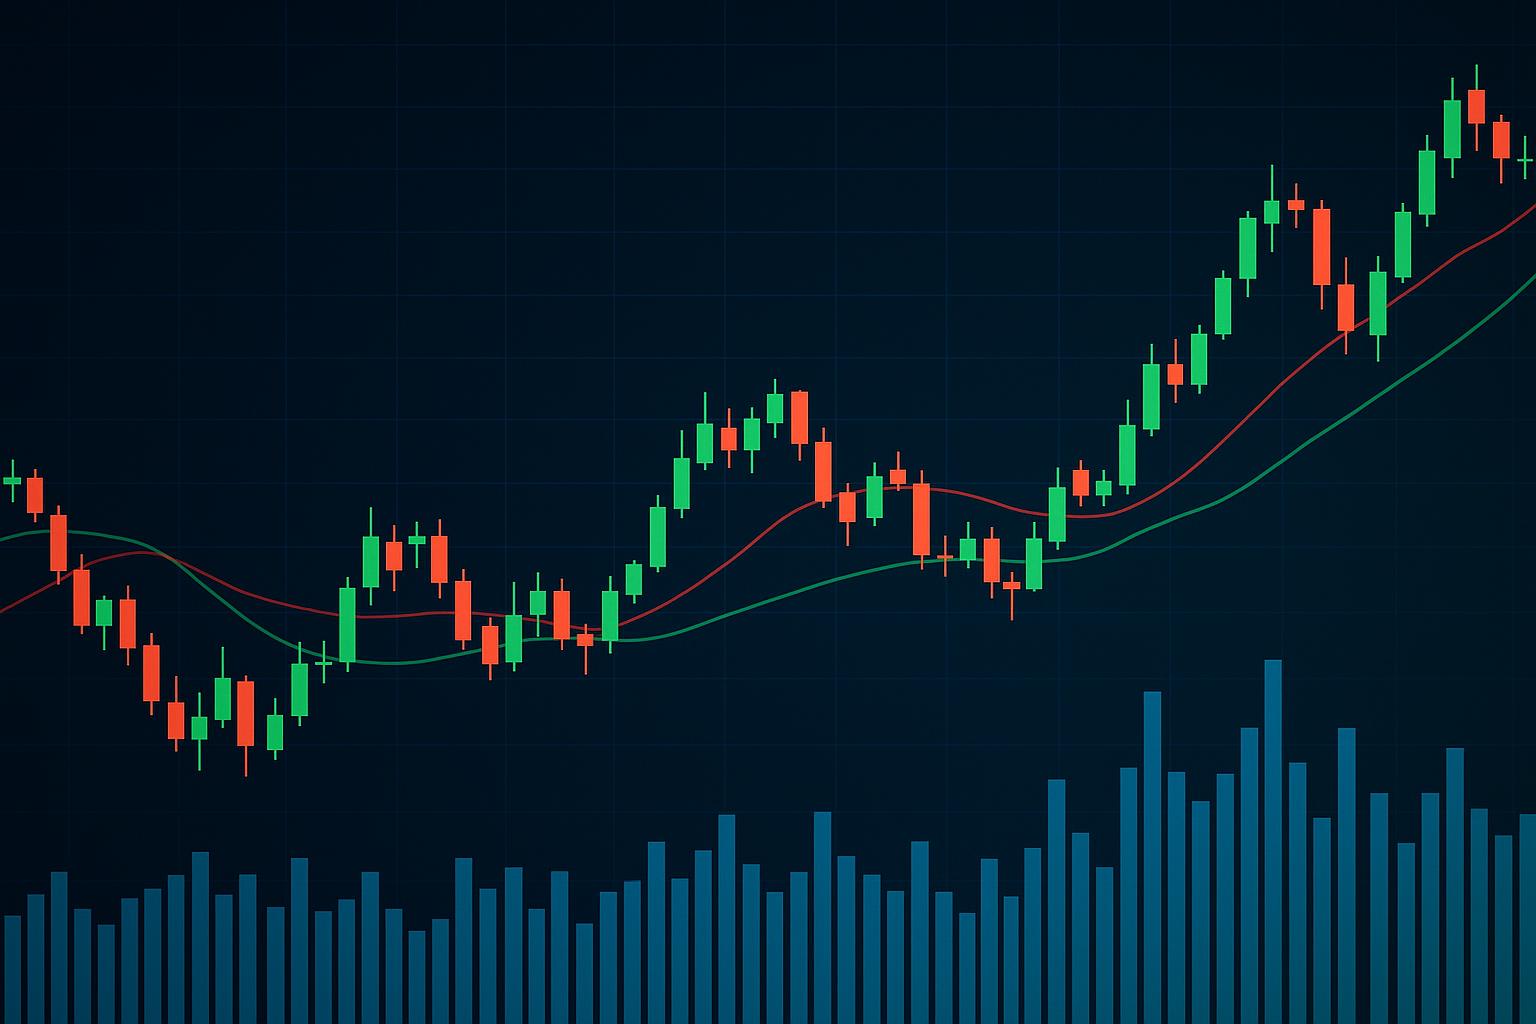
The price line gets all the attention. The bars underneath it get glanced at, if that.
That is backwards, or at least incomplete. Volume on stock graphs is the only part of the chart that tells you how many people agreed with the move. Price without volume is a rumor. Price with volume is a vote count.
You do not need to become a technician to use this. You need to stop reading half the chart.
Price Says What Happened, Volume Says Who Cared
Contents
A stock closes up 4%. Good day, on the face of it.
Now check the bars. If that 4% came on a third of average volume, a handful of orders moved the price in a thin market and almost nobody participated. If it came on triple average volume, institutions were repositioning. Same price move. Two completely different events. Reading stock graphs without that second layer means you cannot distinguish between the two.
The baseline most analysts use is the fifty day average volume. Anything above roughly one and a half times that figure counts as unusual and deserves a reason. Earnings, guidance, an index change, a large holder exiting.
If you cannot find the reason, that is information too.
Breakouts Without Participation Tend To Fail
Here is where volume earns its place on stock graphs for long term investors, not just traders.
A stock pushing through a multi year high on weak volume is being carried by very little conviction. Those moves reverse often, because the buyers needed to sustain the level never showed up. The same breakout on heavy volume means real money committed at that price, which makes the level far more likely to hold as support later.
Watch the pullback, though. That is the part most people skip. A stock that breaks out on heavy volume and then drifts back on light volume is behaving exactly as you would want, because the sellers are not urgent. A pullback on rising volume is a different story entirely.
A Volume Spike On A Down Day Is Not Automatically Bad
Big volume on a decline gets read as panic. Sometimes it is.
Sometimes it is the opposite. Capitulation volume, where a stock drops hard on enormous turnover and then stabilizes, often marks the point where forced sellers finished. The people who had to sell have sold. What follows is usually quieter and steadier, which is why heavy down volume near a multi year low reads differently from heavy down volume after a long run up.
Slow bleeding on modest volume worries me more. That pattern means nobody is panicking and nobody is buying, and the stock is being repriced by indifference rather than by an event.
Reading The Two Together
| Price move | Volume | Reasonable reading |
|---|---|---|
| Up sharply | Heavy | Real accumulation, level likely holds |
| Up sharply | Light | Thin market, treat with suspicion |
| Down sharply | Heavy | Capitulation or genuine repricing, check the news |
| Down sharply | Light | Drift, low conviction on both sides |
| Flat range | Rising | Positioning ahead of something |
On most stock graphs that grid is a prompt for questions, not a set of signal to trade on.
Conclusion
Plenty, and this is where volume analysis on stock graphs gets oversold.
A substantial share of US equity trading happens away from the public exchanges, so the bars you see are an incomplete count. Index rebalancing days generate enormous volume that has nothing to do with anyone’s view of the business. Options expiry weeks distort it. A small float stock can spike on an order that would be invisible in a large cap.
Volume also says nothing about direction. It measures intensity, not intent. Heavy volume tells you the market cared a great deal about something, and the price tells you which way, but neither tells you whether the market was right.
Which is the part worth holding onto. Volume is a confirmation tool. It is not a thesis.
Read the bars as a measure of conviction behind whatever the price already did. A move you can explain fundamentally and that arrived on heavy volume is a move with a real constituency. The same move on thin volume deserves less weight in your thinking, whatever the percentage looks like on the screen.
Volume on stock graphs does not replace knowing what the business earns. It tells you how seriously the market took the last piece of news about those earnings, which is a genuinely useful thing to know and a genuinely terrible thing to build an entire process on.